Average Length of Rental for Repairable Vehicles: Q2 2022
U.S. Length of Rental—Q2 2022
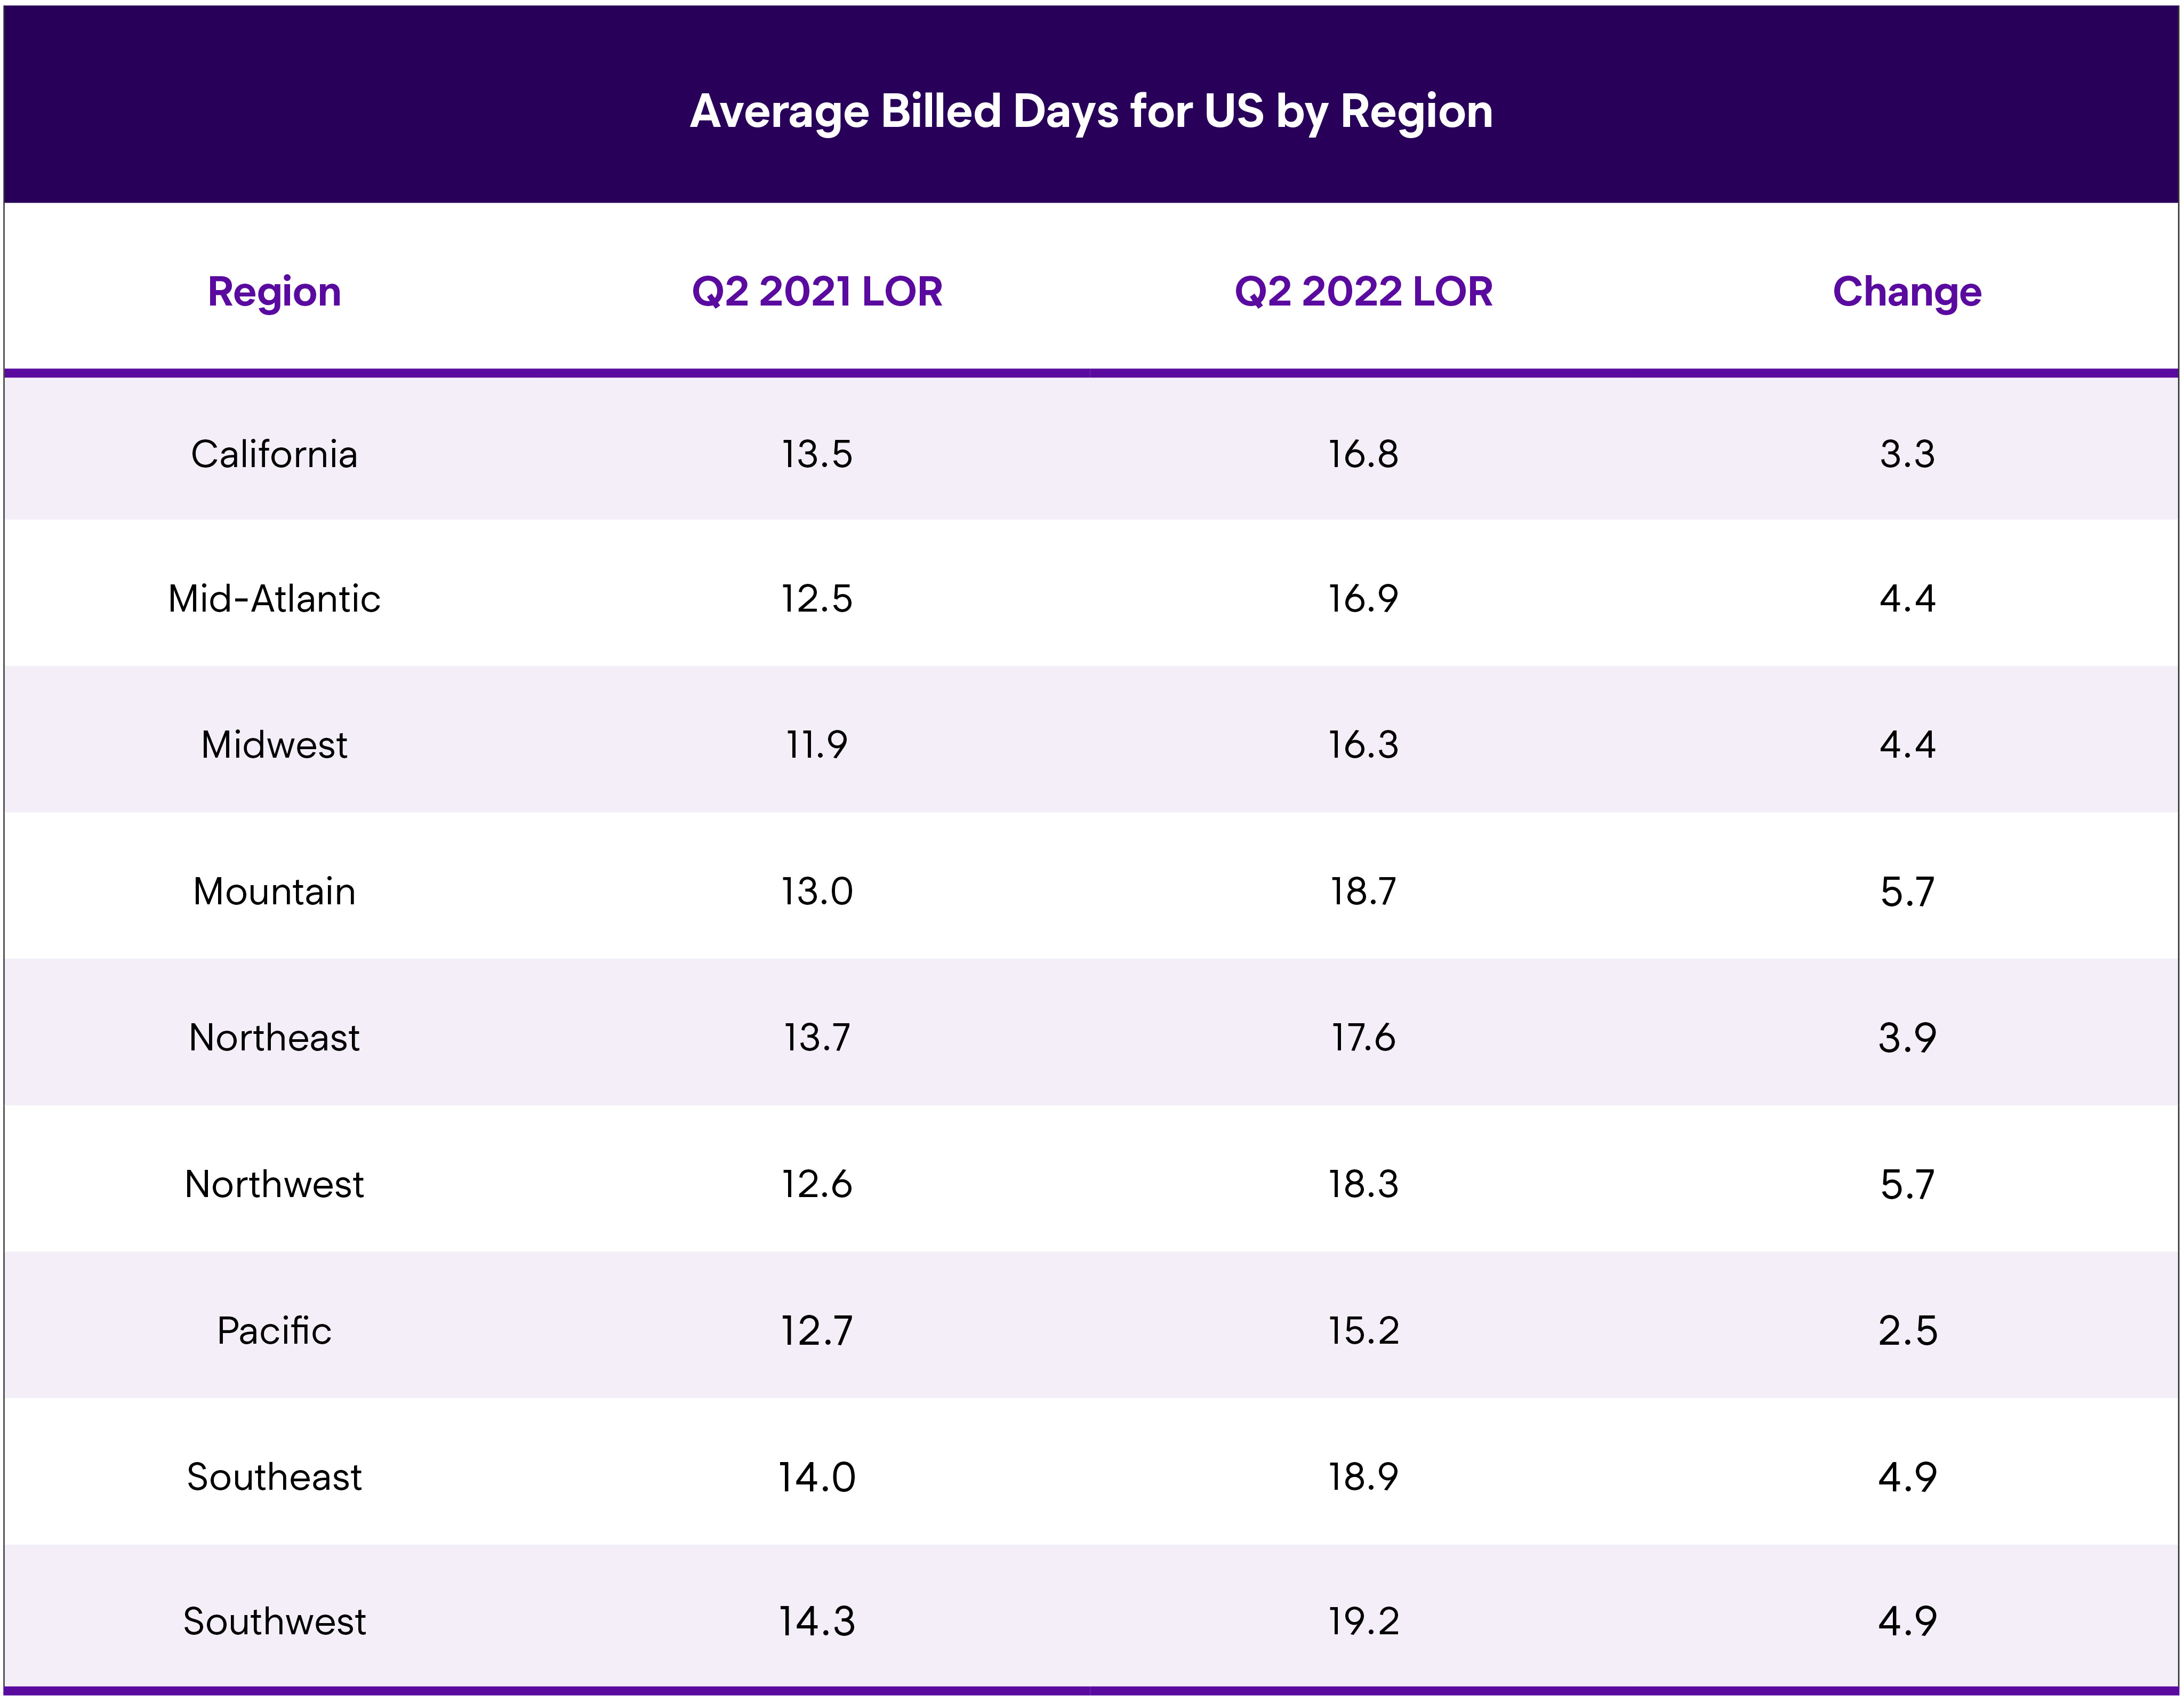
The 2nd quarter of 2022 saw average Length of Rental (LOR) for collision replacement-related rentals at 17.7 days, a 4.5-day increase from the 2nd quarter of 2021. This represents a decrease of half a day from the 1st quarter of 2022 when average LOR was 18.2 days. While the overall totals in 2022 are much higher than previous years, this quarter-to-quarter decrease of a half-day fits historical trending from the 1st quarter of the year to the 2nd quarter. While trending seems to be reverting to historical normalcy, the results themselves continue to illustrate a “new normal.”
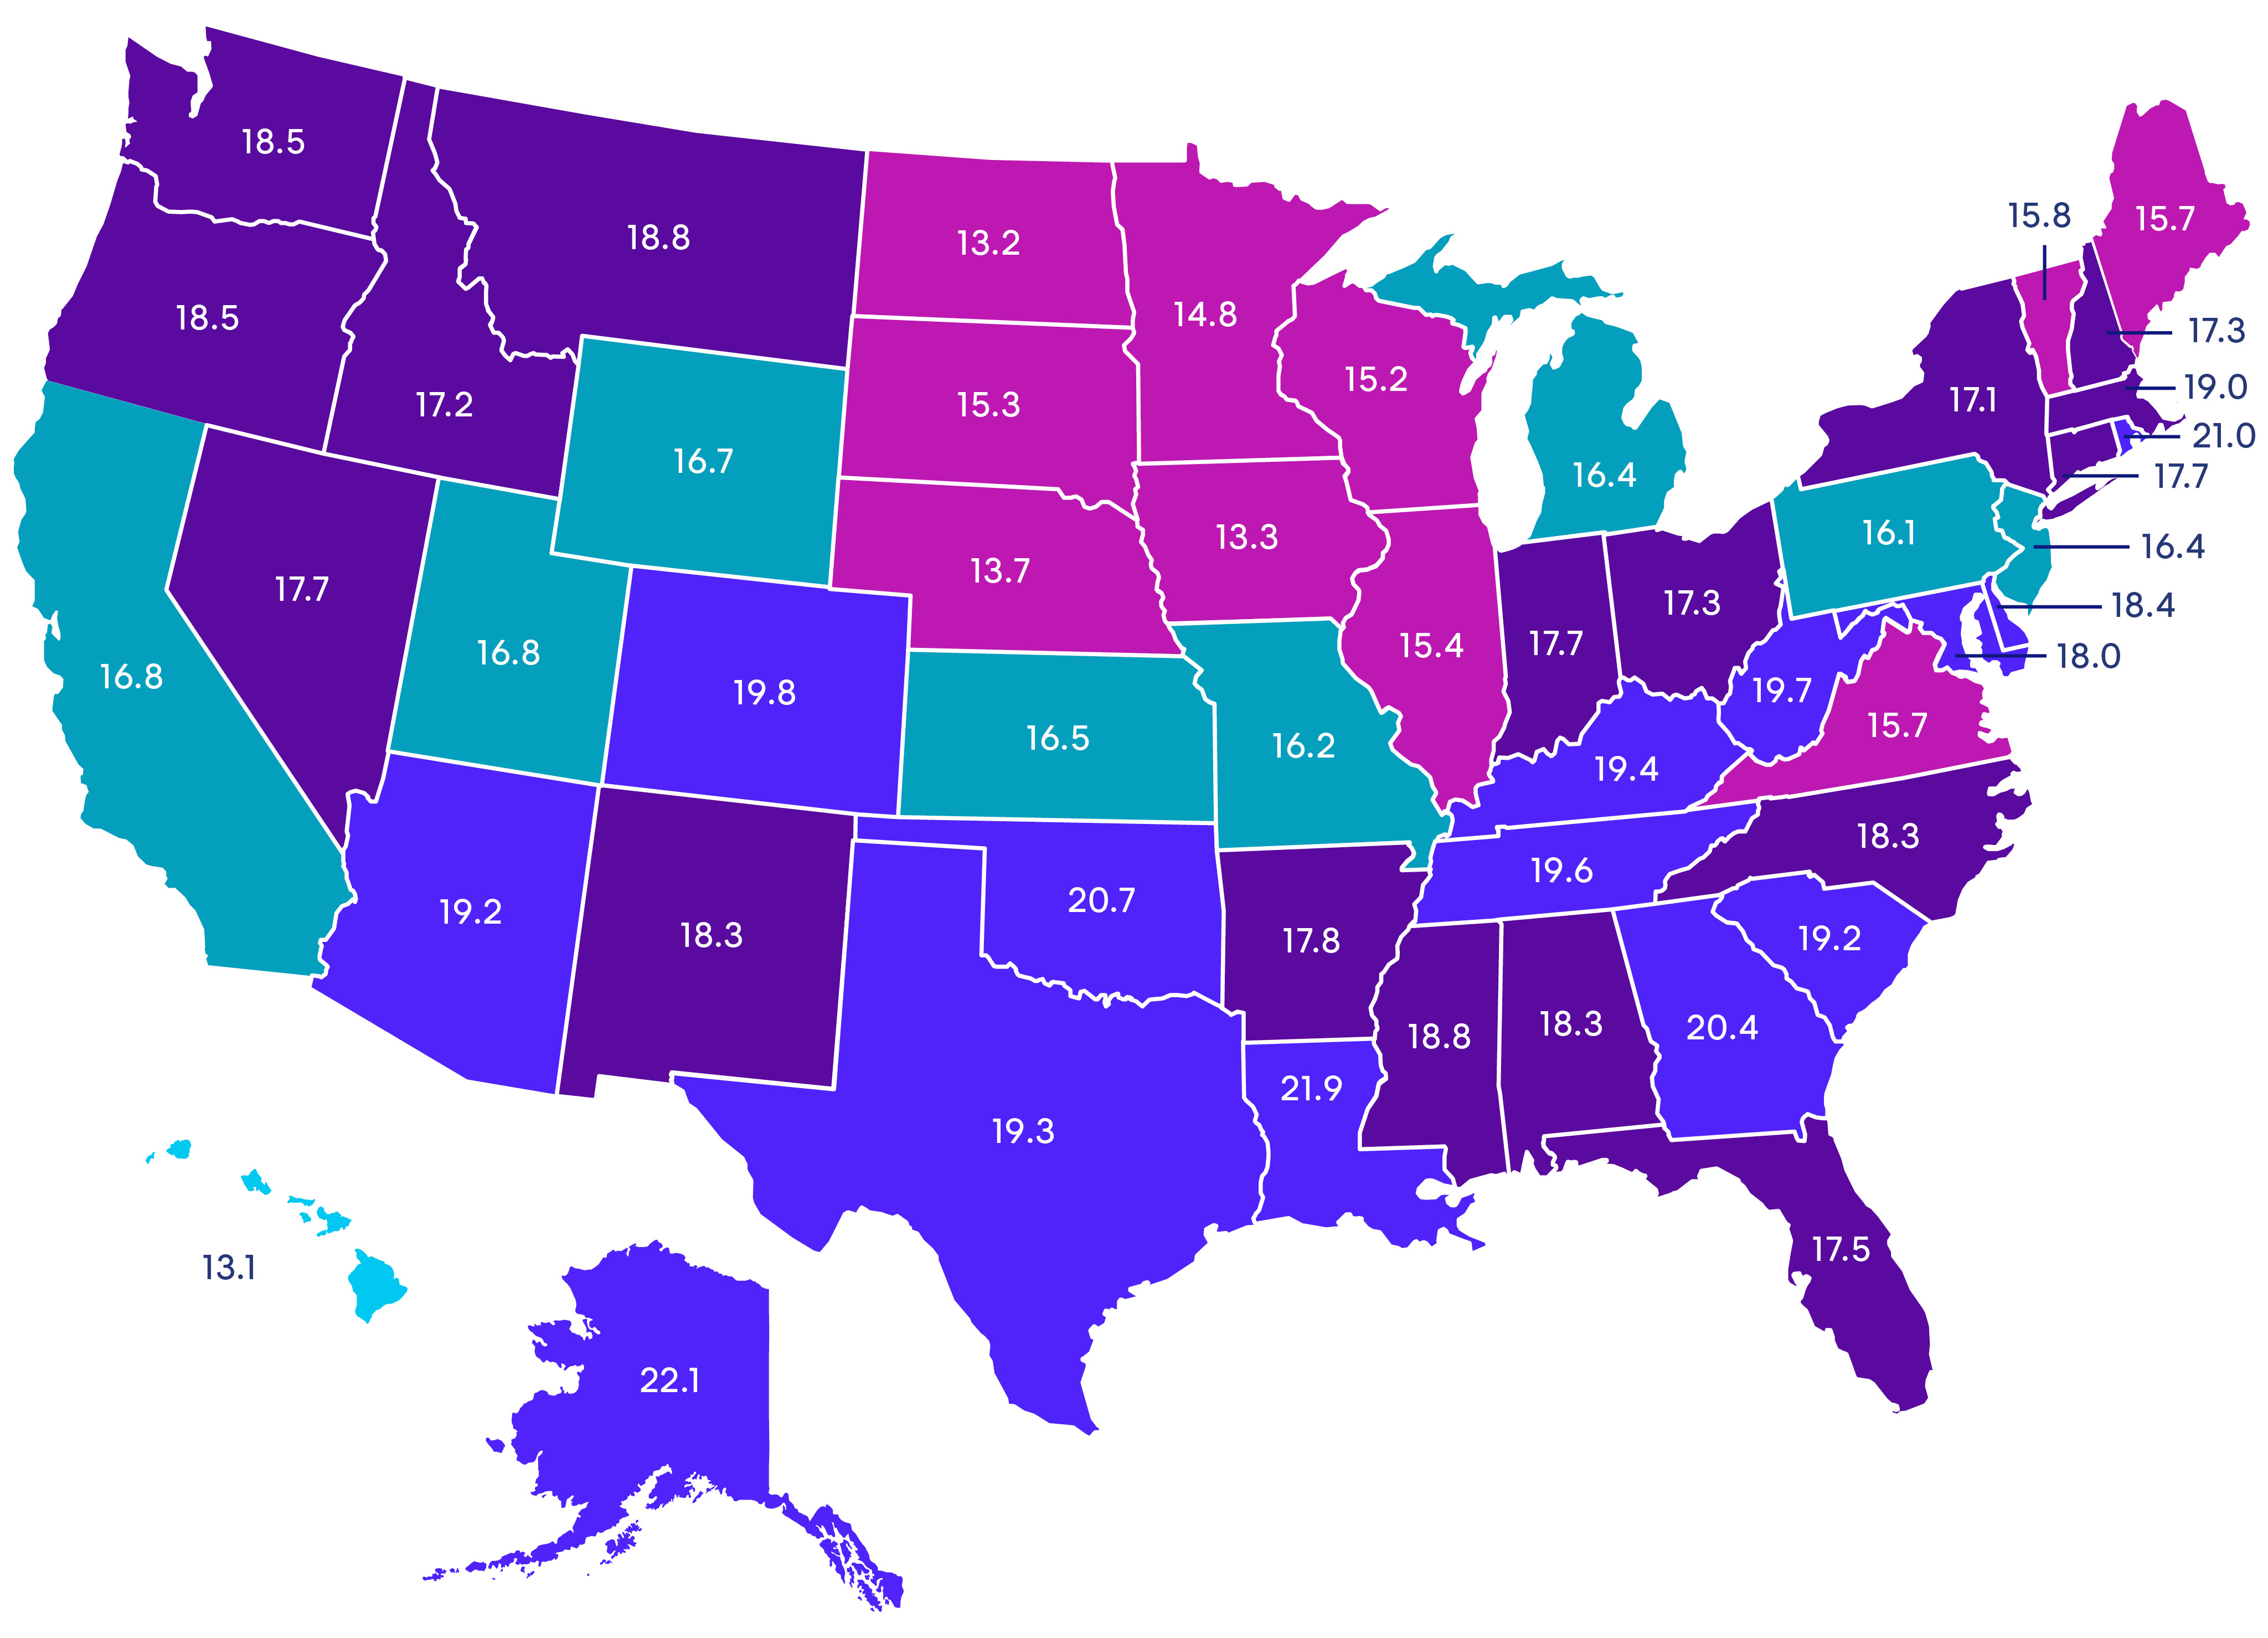
U.S. Average Length of Rental (LOR) By State—Q2 2022
Excludes total losses.
Overall
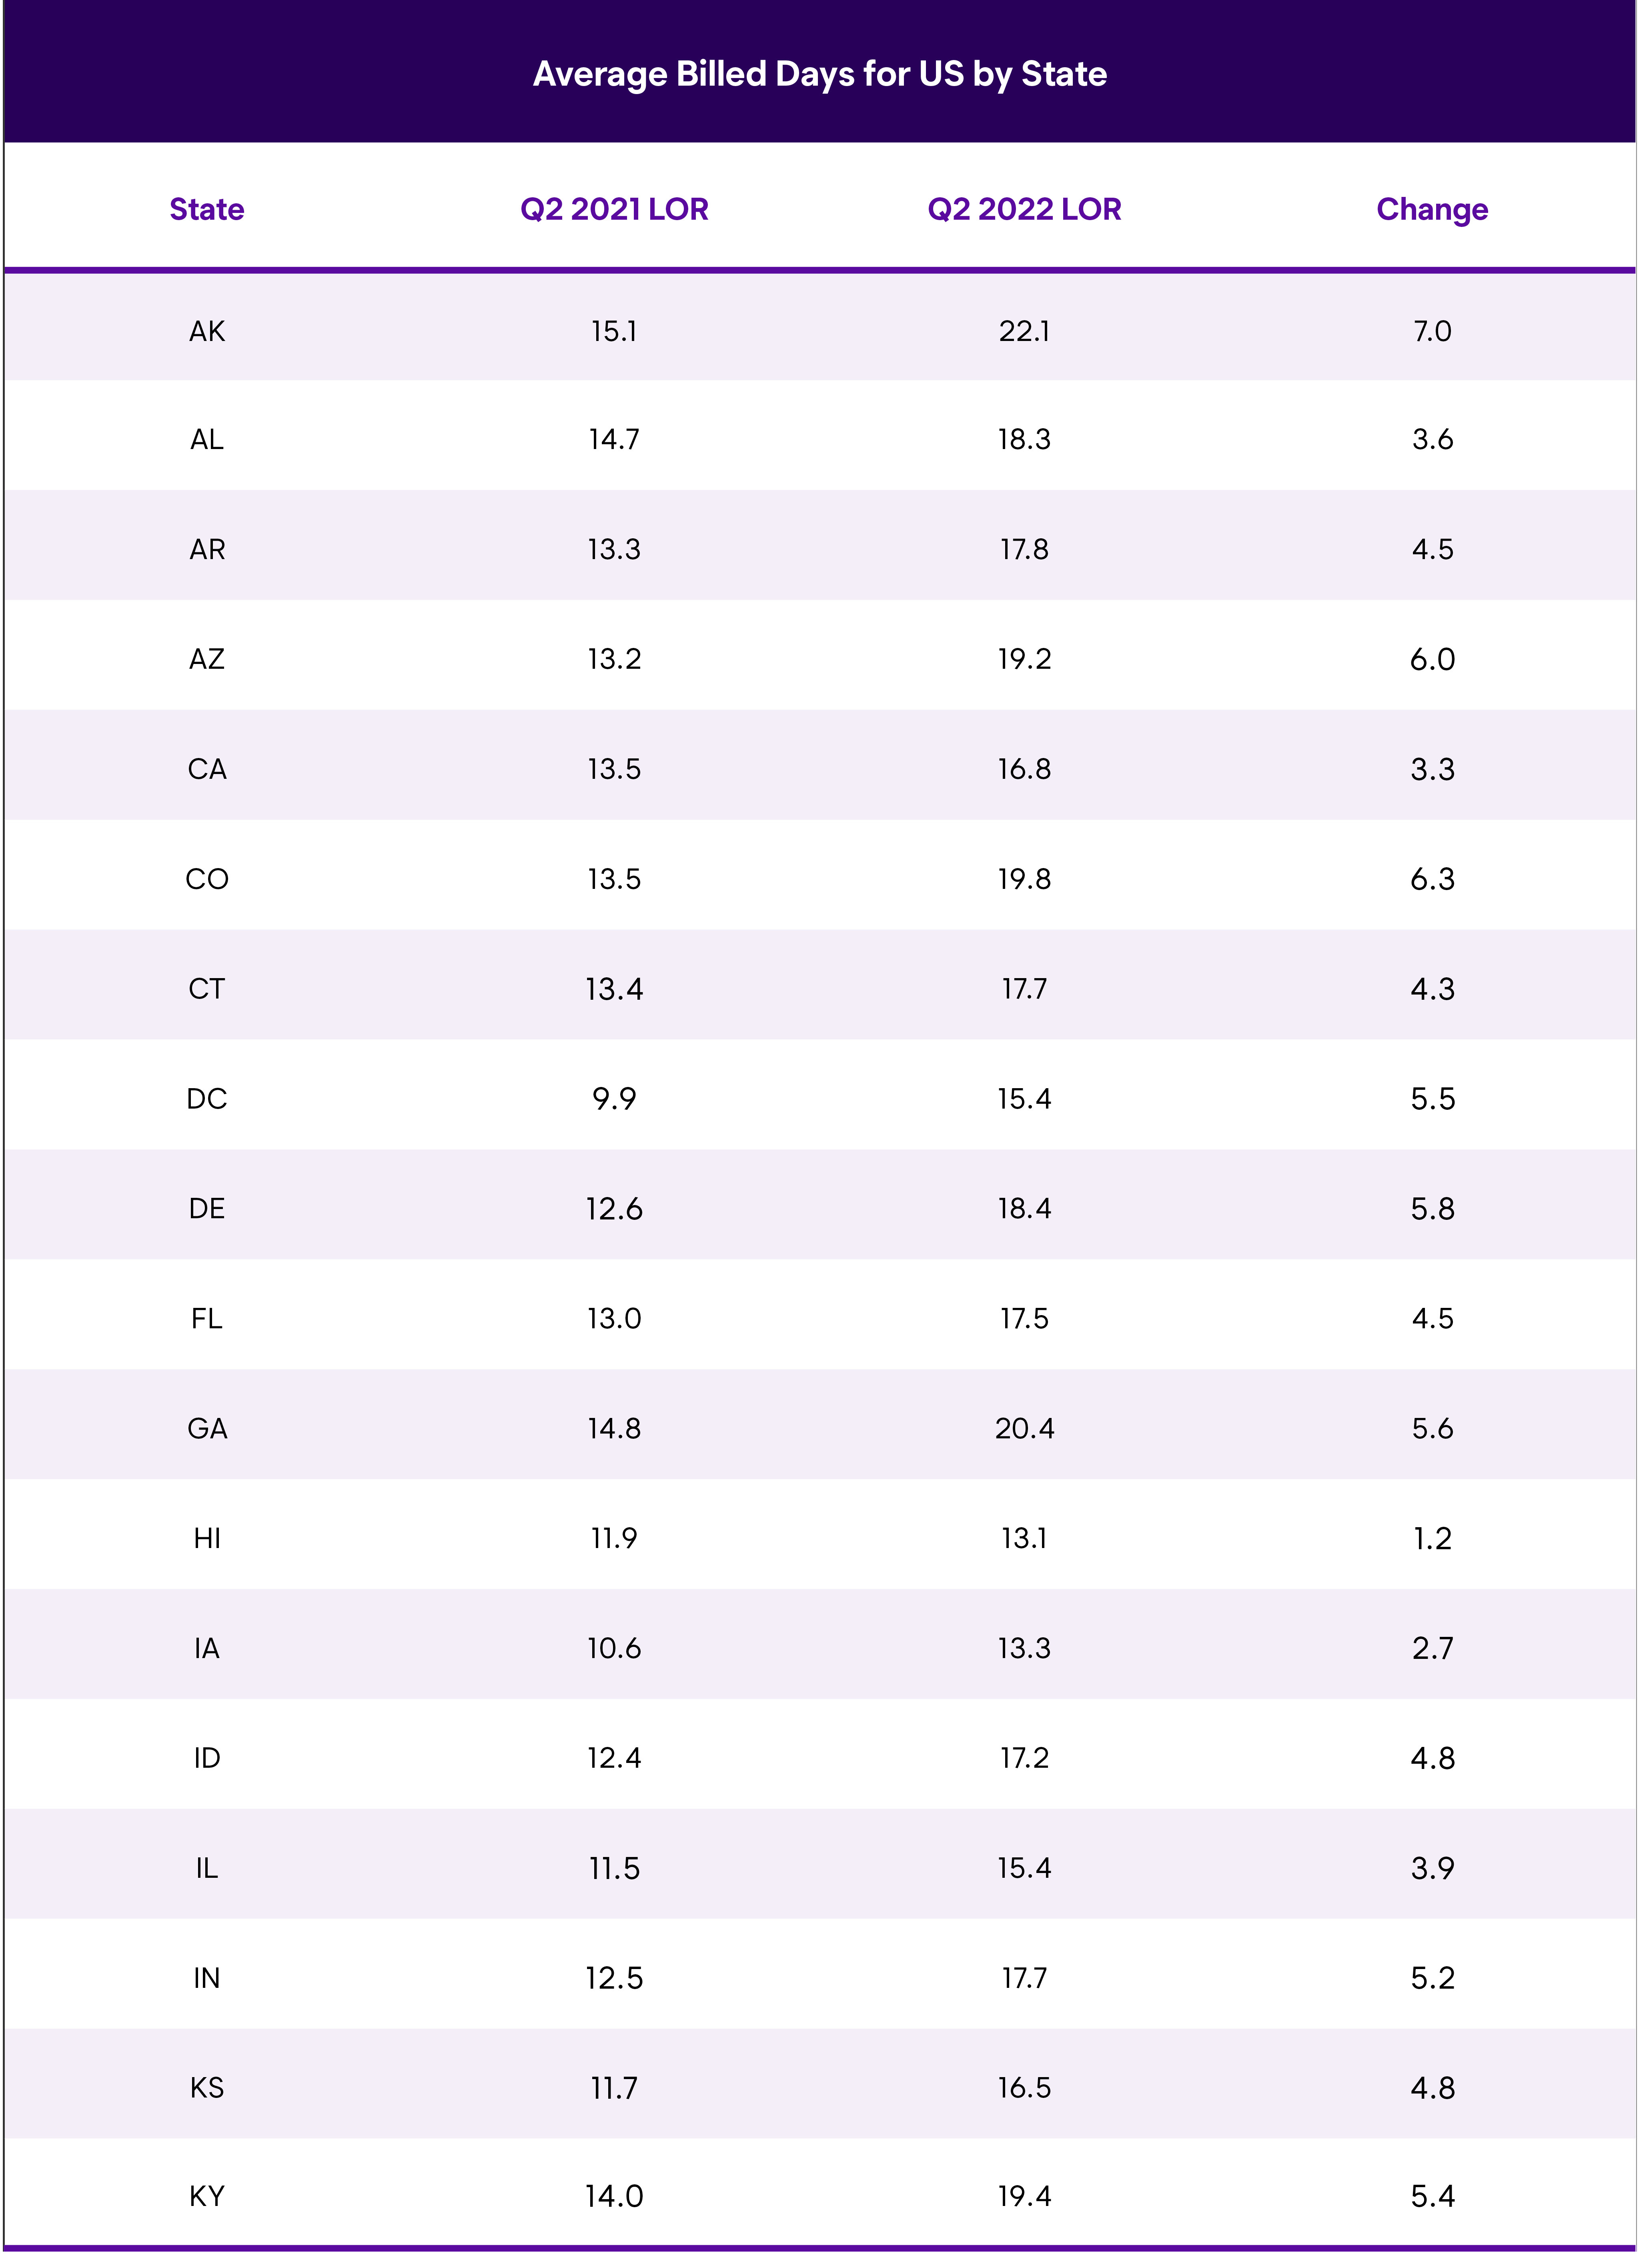
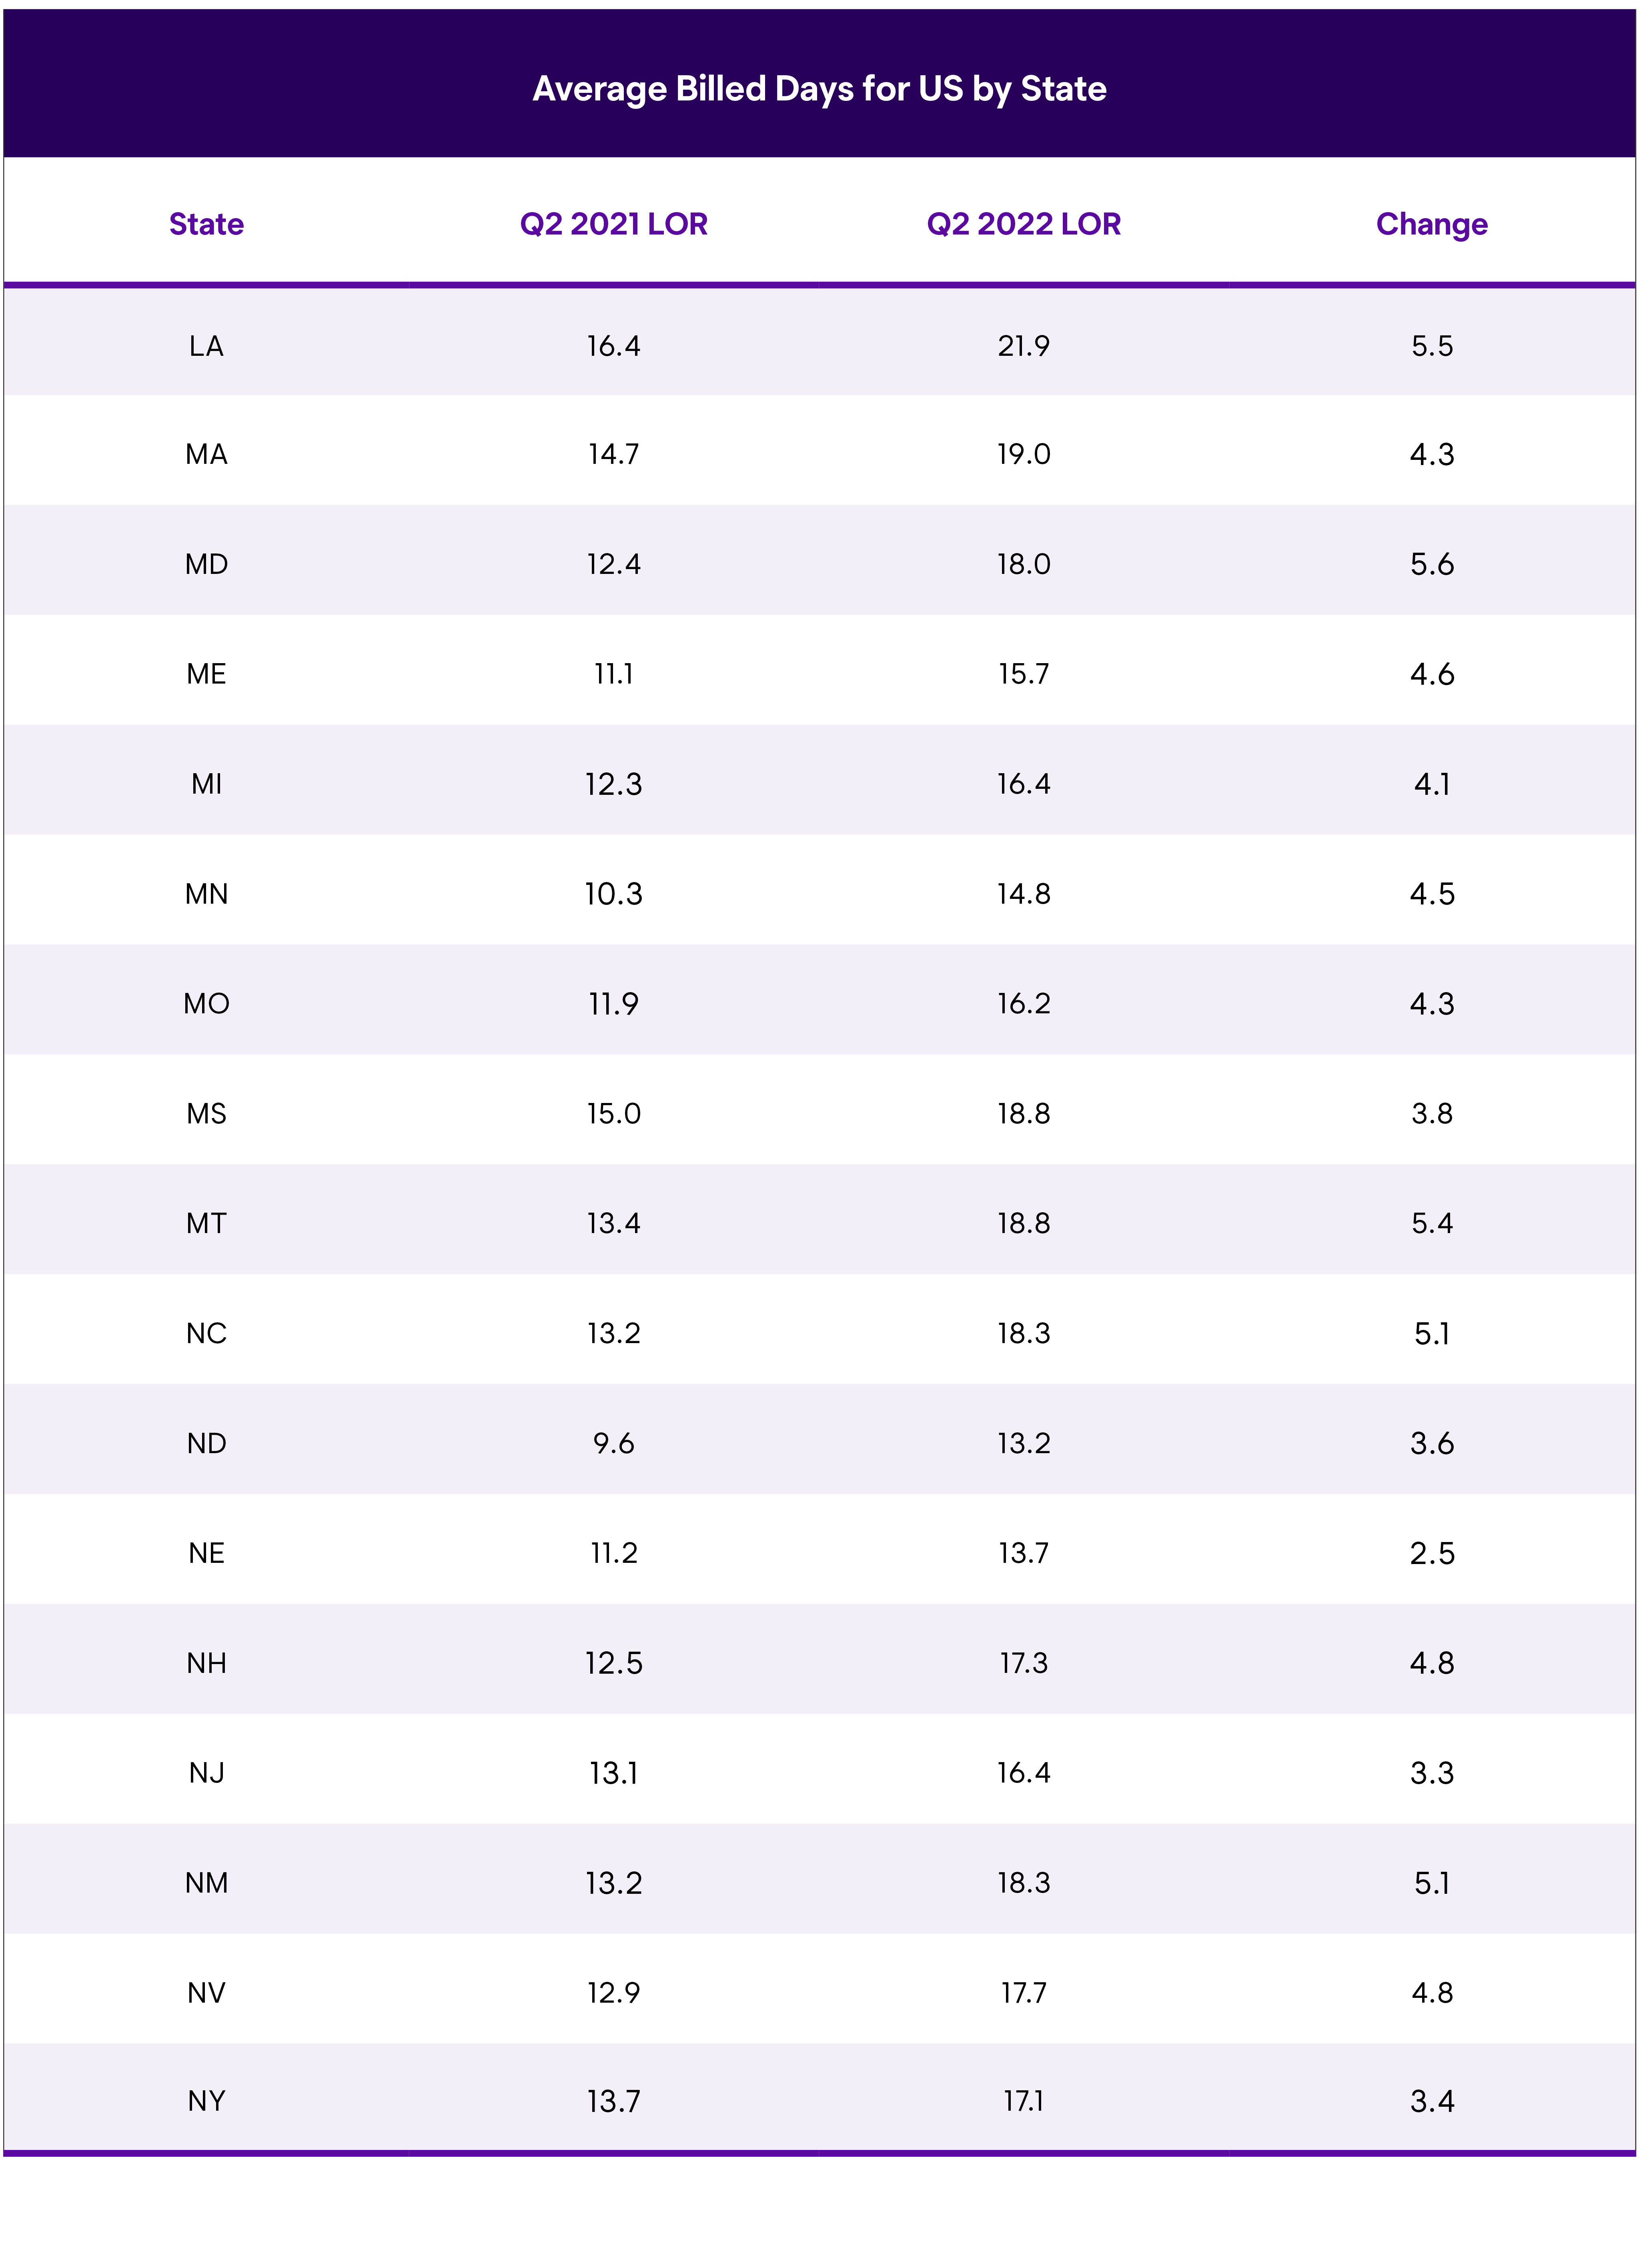
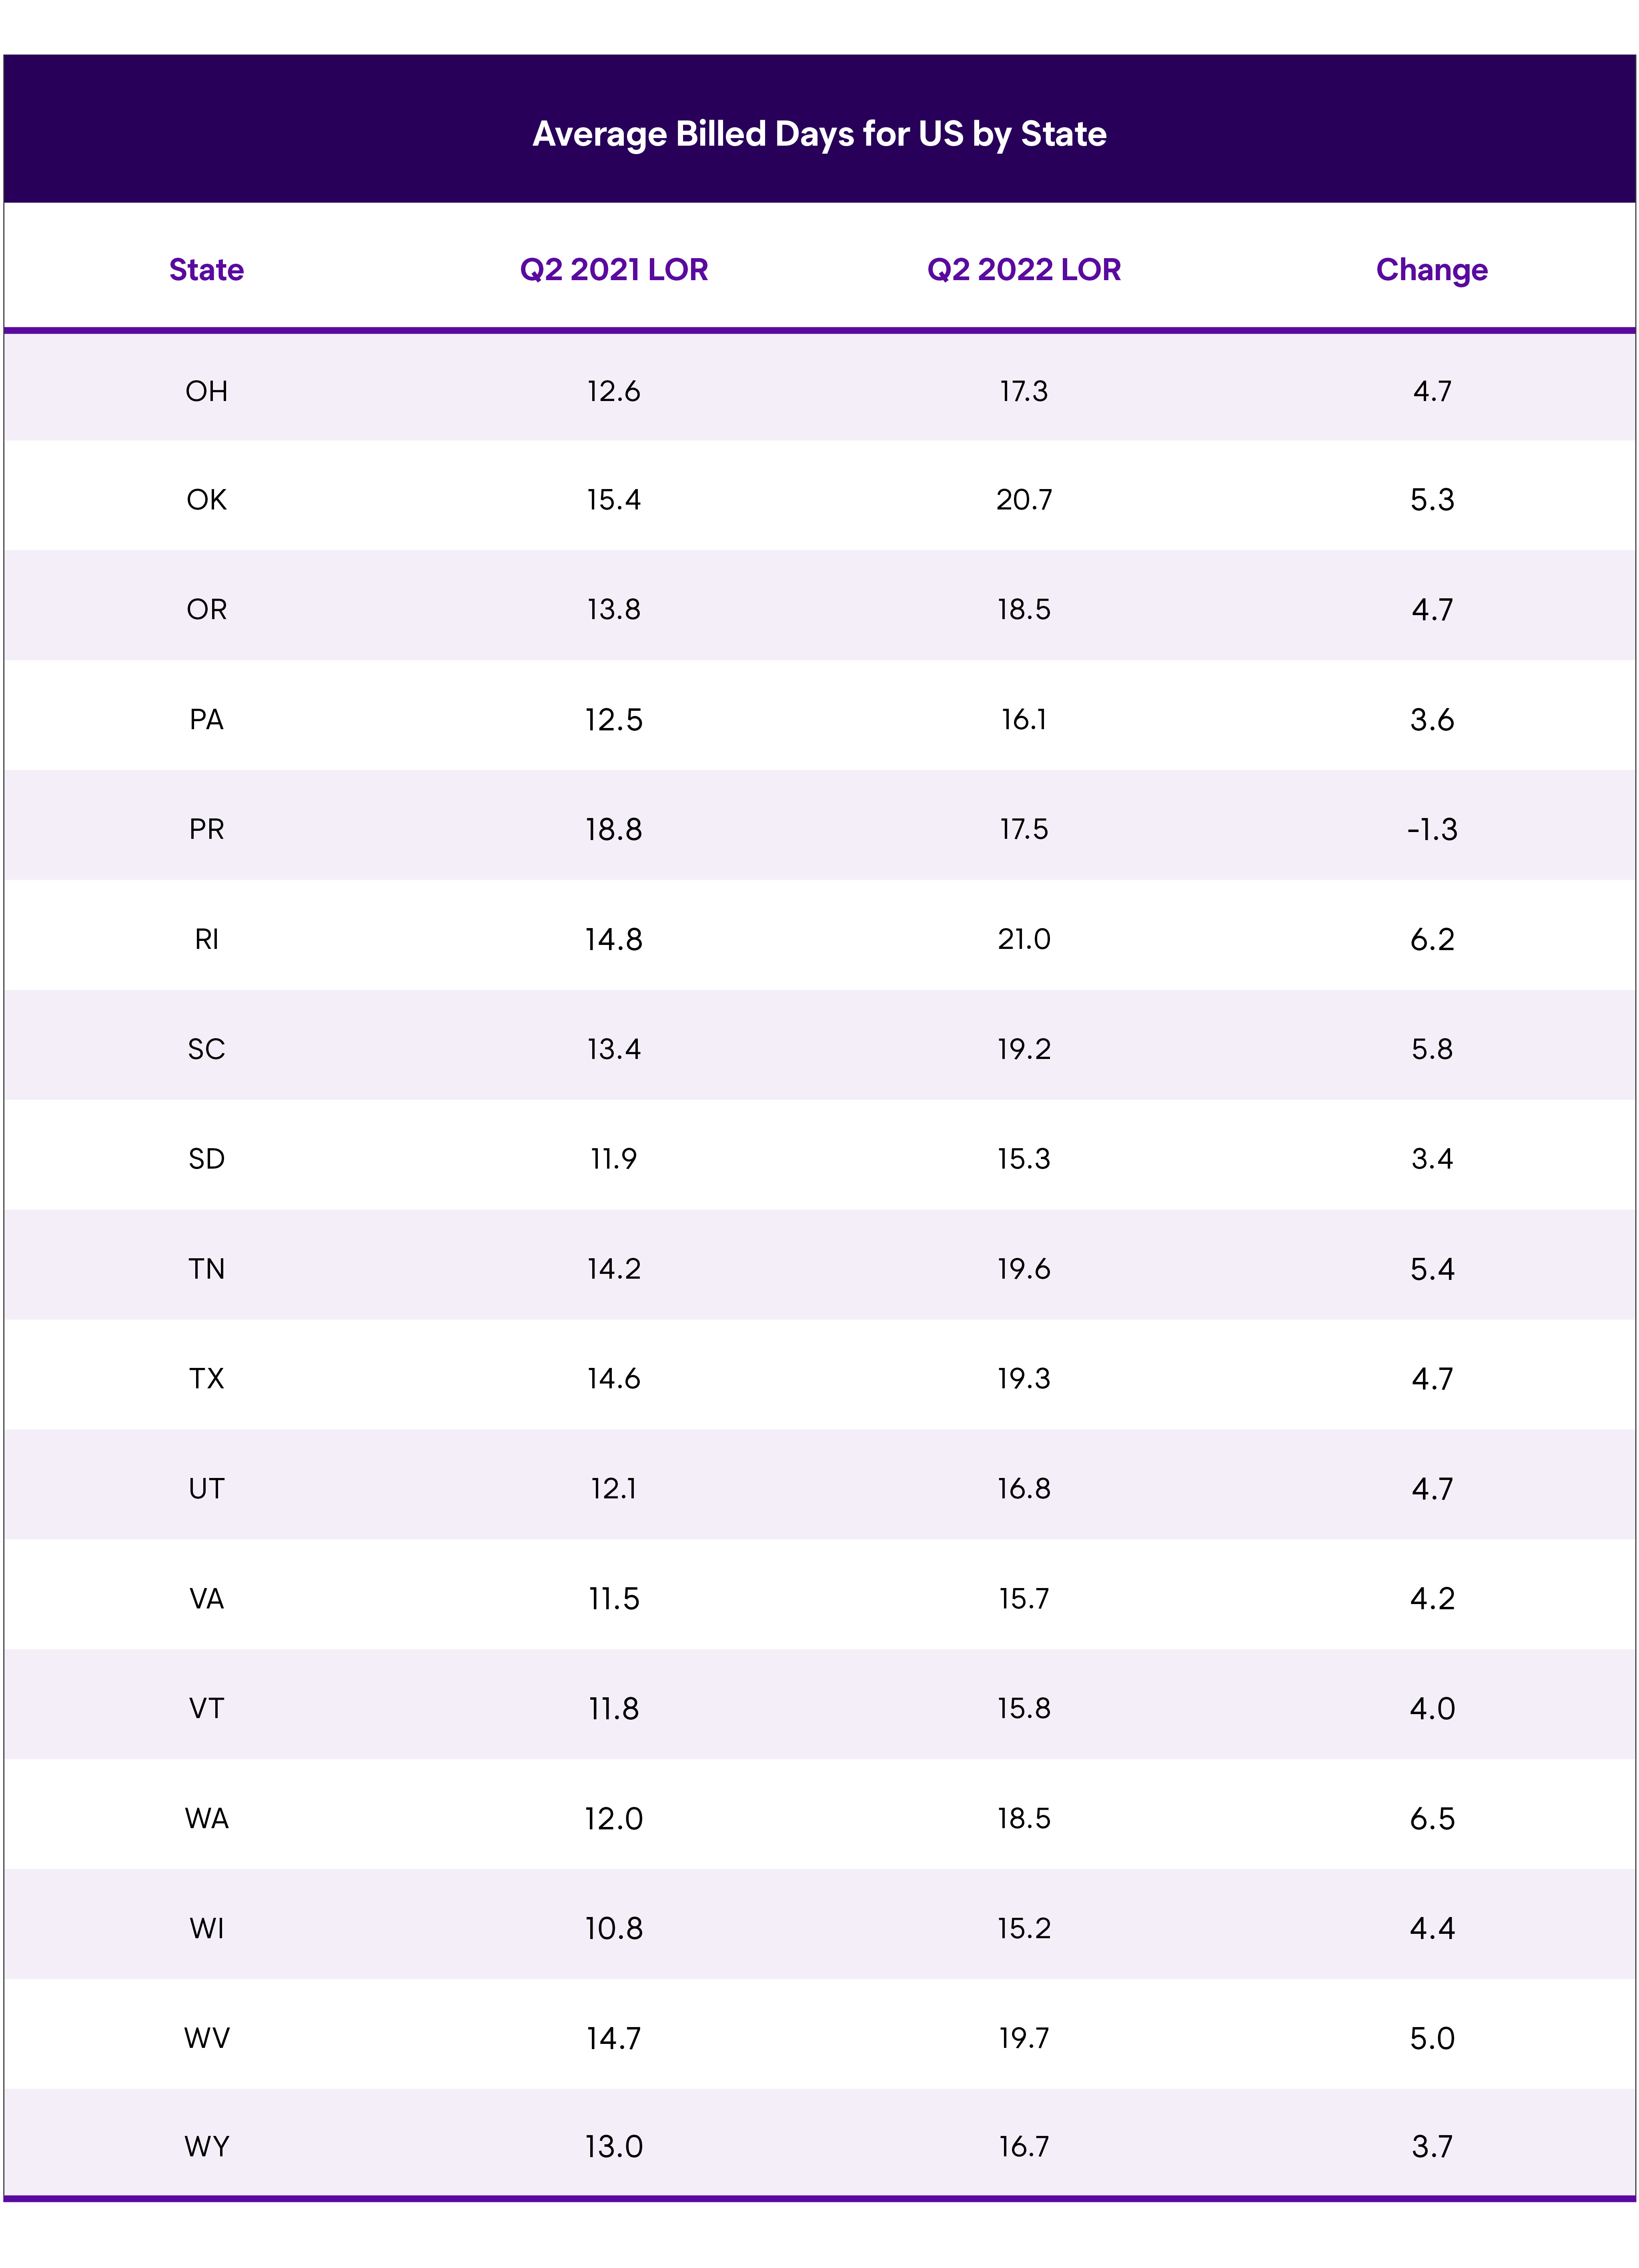
Alaska recorded the highest LOR in Q2 2022 at 22.1 days, which is also the highest year-over-year increase (7.0). Louisiana recorded an LOR of 21.9 days; Rhode Island was third highest at 21.0 days, followed by Oklahoma (20.7) and Georgia (20.4). Eight additional states had a replacement LOR of 19 days or higher, with nine more states recording LOR of 18 days or more.
The states with the lowest LOR were Hawaii (13.1), North Dakota (13.2), Iowa (13.3) and Nebraska (13.7). Hawaii also had the lowest increase from Q2 2021 at 1.2 days. Nebraska (2.5) and Iowa (2.7) were the only other states to have increases less than three full days.
As we noted in Q1 2022’s results, there was little regional difference in the results, confirming the increases as a national occurrence resulting from many factors, including parts availability and delays, staffing, backlogs and processes.
Regarding parts, we spoke with Greg Horn, PartsTrader’s Chief Innovation Officer who oversees their data analytics department. From their data trending, Horn observed: “We look at the median plus two standard deviations to properly capture the impact of delivery days for all parts on the repair. PartsTrader’s Q2 2022 median of 14.9 days, compared to the Q1 2022 median of 15.6 days represents a reduction of 0.7 days, which aligns with the quarter-over-quarter LOR reduction.”
Horn continued: “New OEM parts availability is still driving many delays, but the good news is there are fewer brands showing big delays. Six OEM brands had median (plus 2 standard deviations) delays of more than 20 days in Q1 of this year, while the same was true for only three OEM brands in Q2 2022. As we head in the second half of 2022, aftermarket and recycled parts supply and deliveries are returning to pre-COVID levels. Most OEMs have made significant improvements as well”.
John Yoswick, editor of the weekly CRASH Network newsletter, also shared information regarding parts and repair backlogs: “More than 100 of the 650 shops responding to the latest CRASH Network survey included a written comment about backlog of work. Of these shops, more than one-third cited a similar refrain. “Almost every car waiting on parts. Swamped with work,” a shop owner in San Diego said, according to CRASH Network.
We also spoke with Ryan Mandell, Director of Claims Performance for Ăâ·Ń±¬ÁĎapp International, who offered some additional observations that reflect on LOR and cycle time. Mandell noted, “Luxury vehicle frequency increased to 12.9% in Q2 2022 (compared to 10.3% in Q2 2021). In addition, BEV frequency increased from 0.63% of repairable claims in Q2 2021 to 0.83% in Q2 2022. BEVs on average have 1.3 days longer keys-to- keys cycle times in the US.”
Mandell also provided another interesting analysis. “Comprehensive claims involving a catalytic converter increased from 1.9% in Q2 2021 to 3.5% in Q2 2022. Thefts of catalytic converters are being driven primarily by the increase in rare earth metal prices, which have only been exacerbated by the Ukraine-Russia conflict,” he said.
Drivable Claims
Drivable LOR was 15.2 in the second quarter of 2022, an increase of 3.7 days from Q2 2021’s 11.5 days. Louisiana had the highest LOR for rentals associated with drivable repairs at 19.0 days. The next highest state was Rhode Island at 18.6 days, followed by Georgia at 18.0 days. Three states had an LOR greater than 17 days. Eight more had an LOR of 16 or more days, and 13 states had an LOR of 15 days or more.
North Dakota had the lowest drivable LOR at 10.1 days, followed by Hawaii (10.7), Iowa (11.2) and Nebraska (11.7).
Rhode Island, Arizona, Colorado, Washington, and Georgia had the largest drivable LOR increases in Q2—all being five or more days higher than Q2 2021. Hawaii had the lowest year-over-year increase, with LOR only up 0.7 days.
Non-Drivable Claims
Overall, LOR for rentals associated with non-drivable claims was 26.4 days, up 7.7 days from Q1 2021. In Q1 2022, we noted that five states with non-drivable LORs 30 days or greater for the first time. In Q2 2022, that number rose to eight states: Alaska (34.7); Montana (32.9), Louisiana (32.0), Colorado (31.8), West Virginia (31.6), Oklahoma (30.9), Delaware (30.5), and Washington (30.0).
Markedly, eight states had non-drivable LOR increases of 10 days or greater over last year, with Washington representing the highest increase (12.3). Fourteen states had year-over-year increases of 9.0 days or greater, and nine other states plus DC had increases of eight days or greater.
Iowa had the lowest non-drivable LOR at 22.1 days. New York was second at 22.5, followed by Nebraska at 22.8. Massachusetts had the lowest year-over-year increase of “only” 4.2 days.
Given recent trending, we broke down LOR by first-party insureds and third-party claimants. Overall, insured replacement rental LOR was 17.1 days in Q2 2022, whereas claimant rental LOR was 18.7 days.
Focusing specifically on non-drivable rentals, insured LOR was 24.1 days in Q2 2022, a six-day increase from Q2 2021. West Virginia’s insured non-drivable LOR was 28.6, followed by Delaware at 28.1. Sixteen additional states had insured non-drivable LOR greater than 25 days. Virginia came in lowest at 19.9 days.
Claimant non-drivable LOR was 33.8 days, a 12.8-day increase from Q2 2021. Alaska’s claimant non-drivable results help explain some of the increase—their LOR was 52.9 days in Q2 2022. This is a 25-day jump from Q2 2021. Vermont (43.8), Louisiana (42.5), Montana (41.4), Colorado (40.6) and West Virginia (40.2) were other LORs greater than 40 days.
According to the weekly CRASH Network newsletter, the national average repair backlog remains near record levels. While scheduled work at shops nationwide eased somewhat in the second quarter, it was not nearly as much as generally happens heading into spring. The length of time a customer is likely to currently wait to get their vehicle repaired has not changed significantly from this past winter’s record-high backlogs. Shops on average are still scheduling work out a full month—4.3 weeks compared to 4.5 weeks in the first quarter of 2022. The decline of 0.2 weeks is only about half the usual decline in backlog between the first and second quarter, when spring brings a seasonal drop-off in winter weather-related accidents and the average shop backlog has typically fallen by 0.4 weeks. General trending of repair volume correlates with historical trending of LOR.
Yoswick shared: “More than 13% of shops are still scheduling more than eight weeks out, a percentage that, until this past winter, hadn’t exceeded 2%. Shops with three months of backlog are not uncommon.” “Cosmetic work is 11 weeks out, non-drivers are four to five weeks out,” the manager of an independent shop in Fort Wayne, Indiana, shared with CRASH Network. An estimator in Georgia, when asked about current backlog last month, said simply, “Middle of July!”
Almost four in five shops (79%) are scheduling two or more weeks into the future. Less than 3% of shops have no backlog and can start on a new job right away.
Only two regions in the country (South Central and West) have an average backlog of less than four weeks. The shortest average backlog in the West, including California, is 3.1 weeks. Until this past winter, that region had never exceeded an average backlog of 1.5 weeks (in the more than five years CRASH Network has been tracking the statistic). The longest backlogs are in the Pacific Northwest, where shops are scheduling work 5.2 weeks in advance, on average.
When describing parts availability’s impact to the repair backlogs, PartsTrader’s Horn agreed: “While there are parts availability improvements in Q2 2022, delays still exist in the OEM parts supply chain and consequently, shops are scheduling farther out to protect themselves from potential parts delays.”
Another consideration with non-drivable LOR is in the communication process between shop and insurer. We spoke with Dominic Martino, owner of Gold Coast Auto Body in Chicago, who shared: “We are consistently seeing 7 to 10 business days elapse between initial estimate or supplement submission and repair authorization. And if the submission requires reconciliation, we could see an additional 3 to 5 days. When insurer staff are coming into the shop in-person, we see reconciliation times drop to 24-48 hours.”
Total Loss Claims
The LOR for rentals associated with total loss claims was 17.3 days in Q2 2022, up 3.1 days from 14.2 in Q2 2021. Washington was highest at 22.8 days, followed by Oregon (20.9), West Virginia (20.8), Alaska (20.2), Idaho (20.1) and North Carolina (20.1). Iowa was lowest at 14.2 days, followed by Wisconsin (14.5), Nebraska (14.5), Wyoming (14.6), Florida (14.8) and Maine (14.9).
While Washington’s results were an increase of 8.4 days from Q2 2021, Hawaii (17.2) dropped 1.2 days, and Wyoming saw a small drop of 0.2 days. Notably, California (16.6) was only up 0.6 days.
Mandell noted: “With used vehicle values reaching new highs in Q2 2022, total loss frequency continued to decline to the lowest level in the past six years at 14.2% (compared to 17.1% in Q2 2021).”
Canadian Average Length of Rental (LOR) By Province—Q2 2022
Excludes total losses.
Canada Length of Rental—Q2 2022
The first quarter of 2022’s results showed a four-day increase in Length of Rental (LOR) for collision replacement-related rentals in Canada. Would the second quarter show similar results? Would the historical trending of the second quarter as lowest in LOR return?
Overall
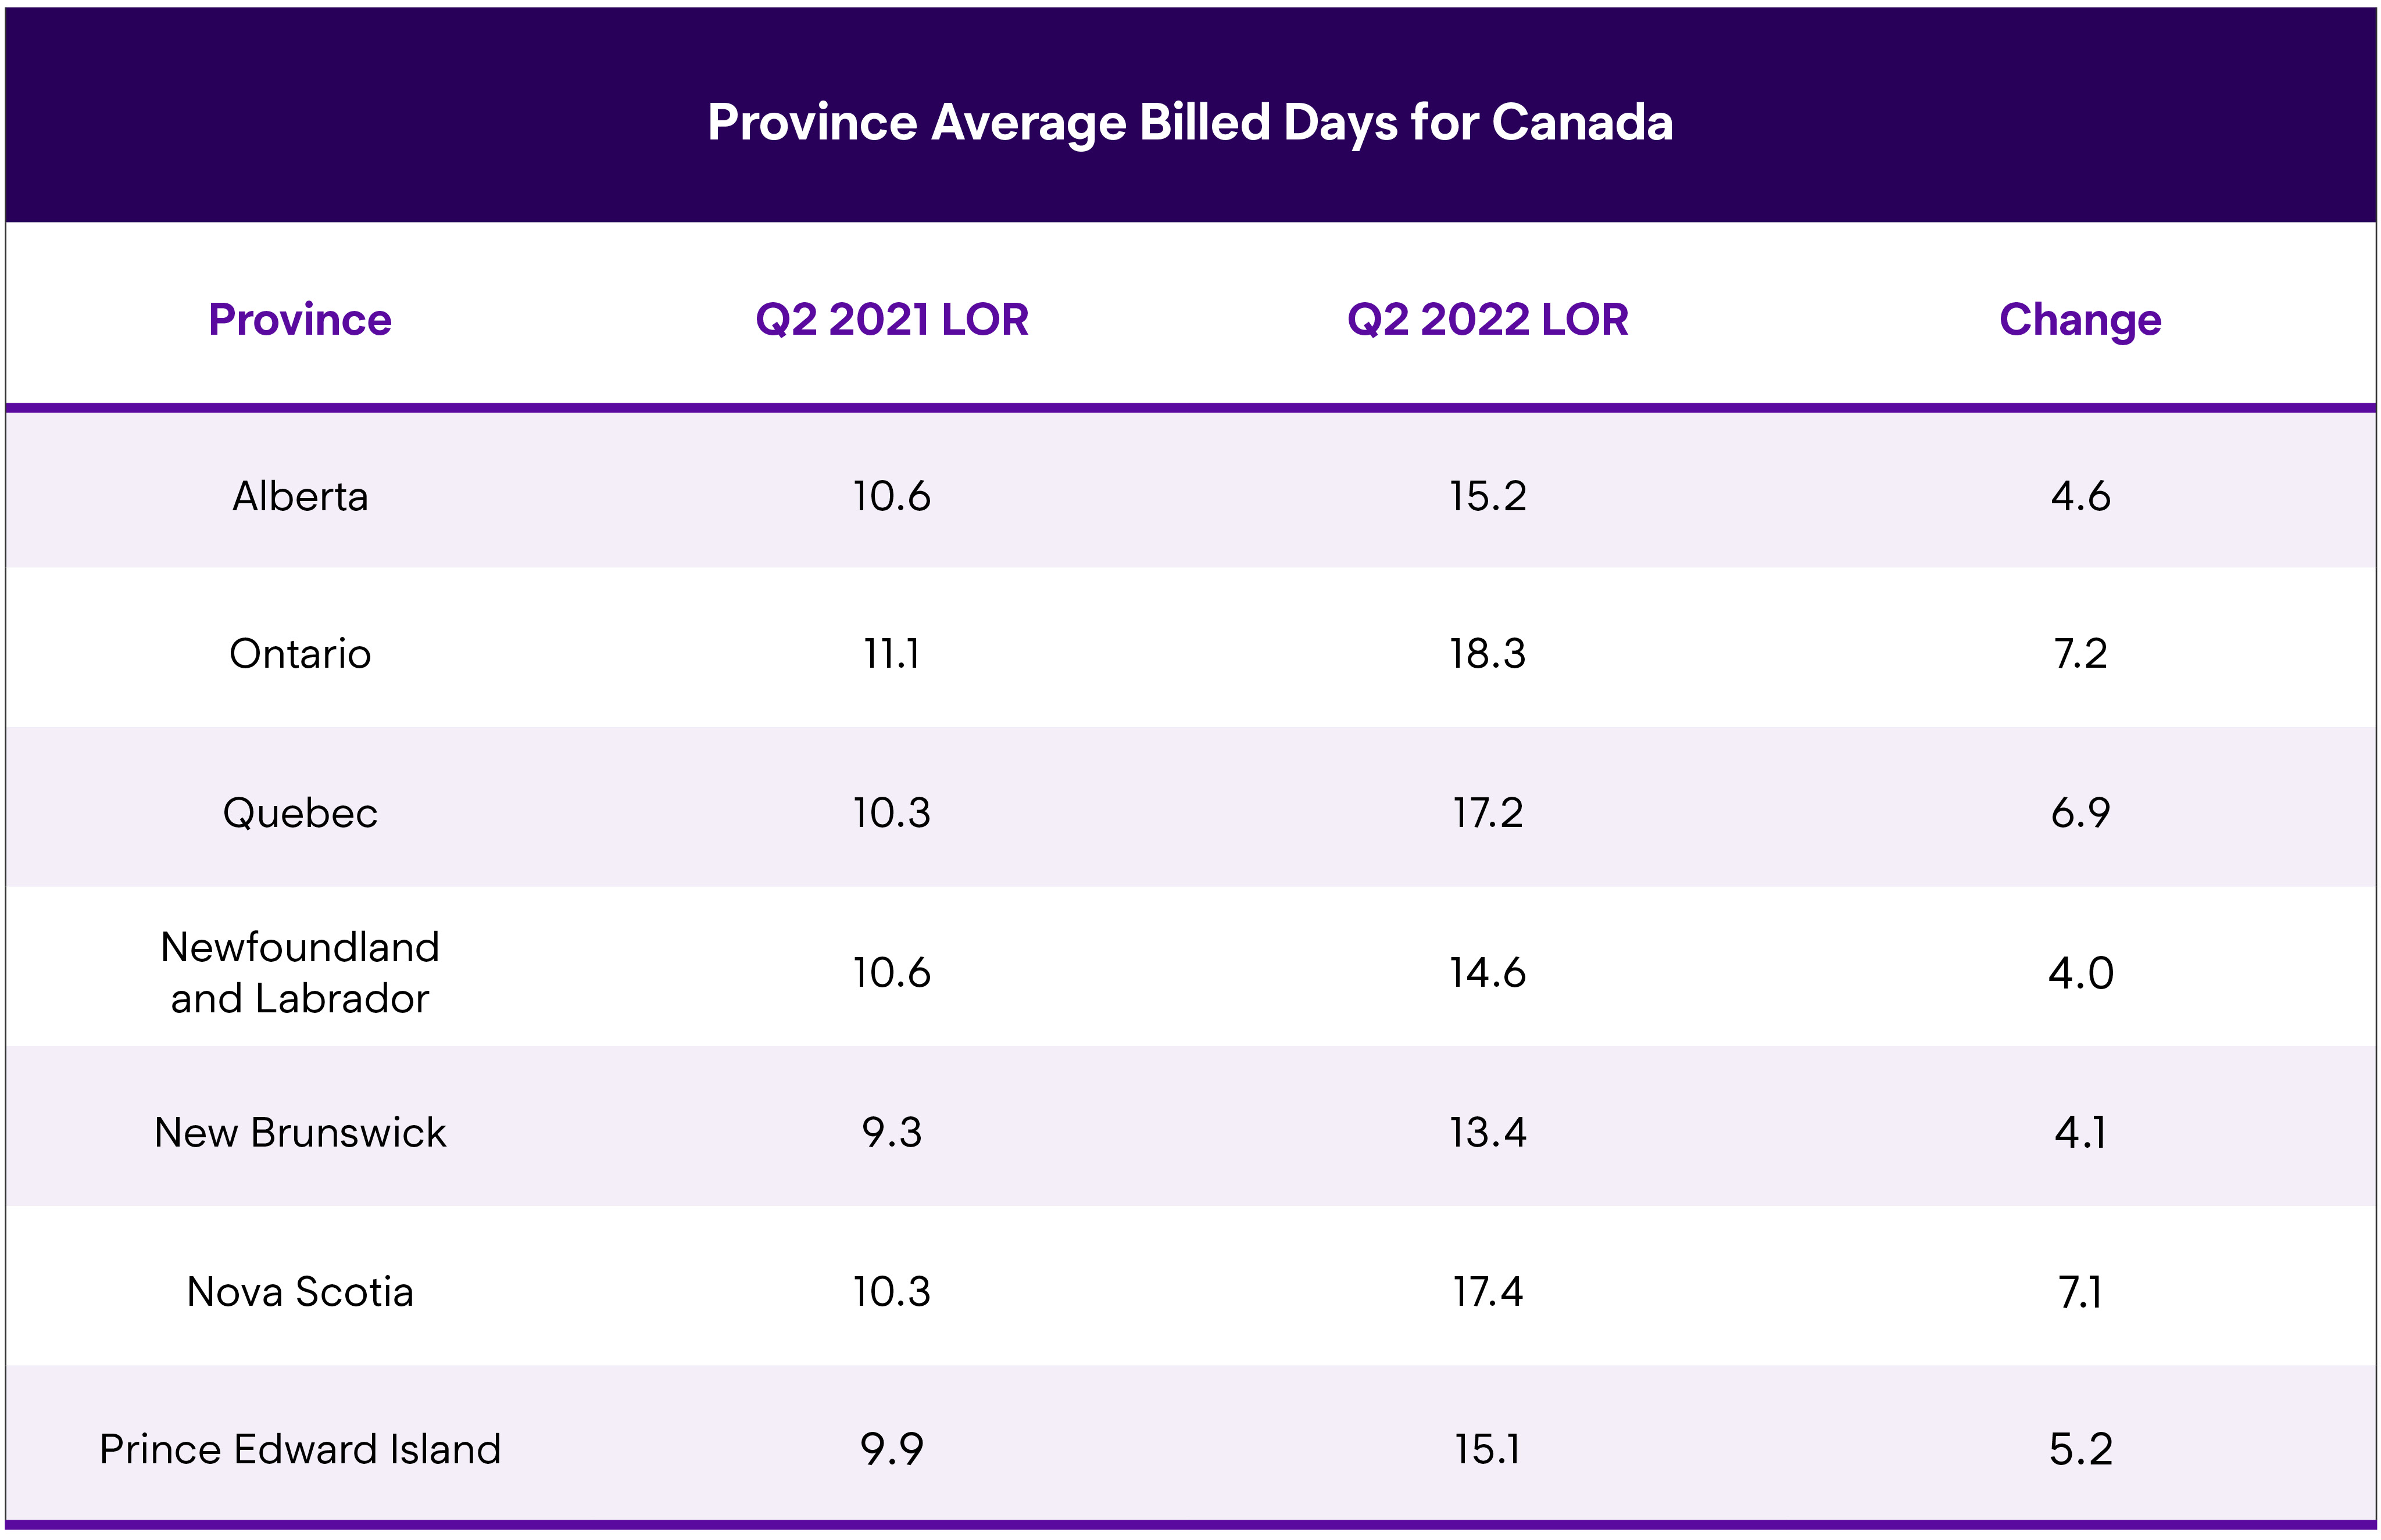
The overall Canadian LOR was 16.0 days in Q2 2022, an increase of 5.8 days from Q2 2021 and an increase of almost a full day (+0.9) from Q1 2022. Canada’s results seem similar to those observed in the US—with historical quarter-over-quarter trending returning to normal while year-over-year LOR continues to increase. For comparison, the overall LOR in the US in Q2 2022 was 17.7, so while Canada’s results are superior, the gap has significantly lessened.
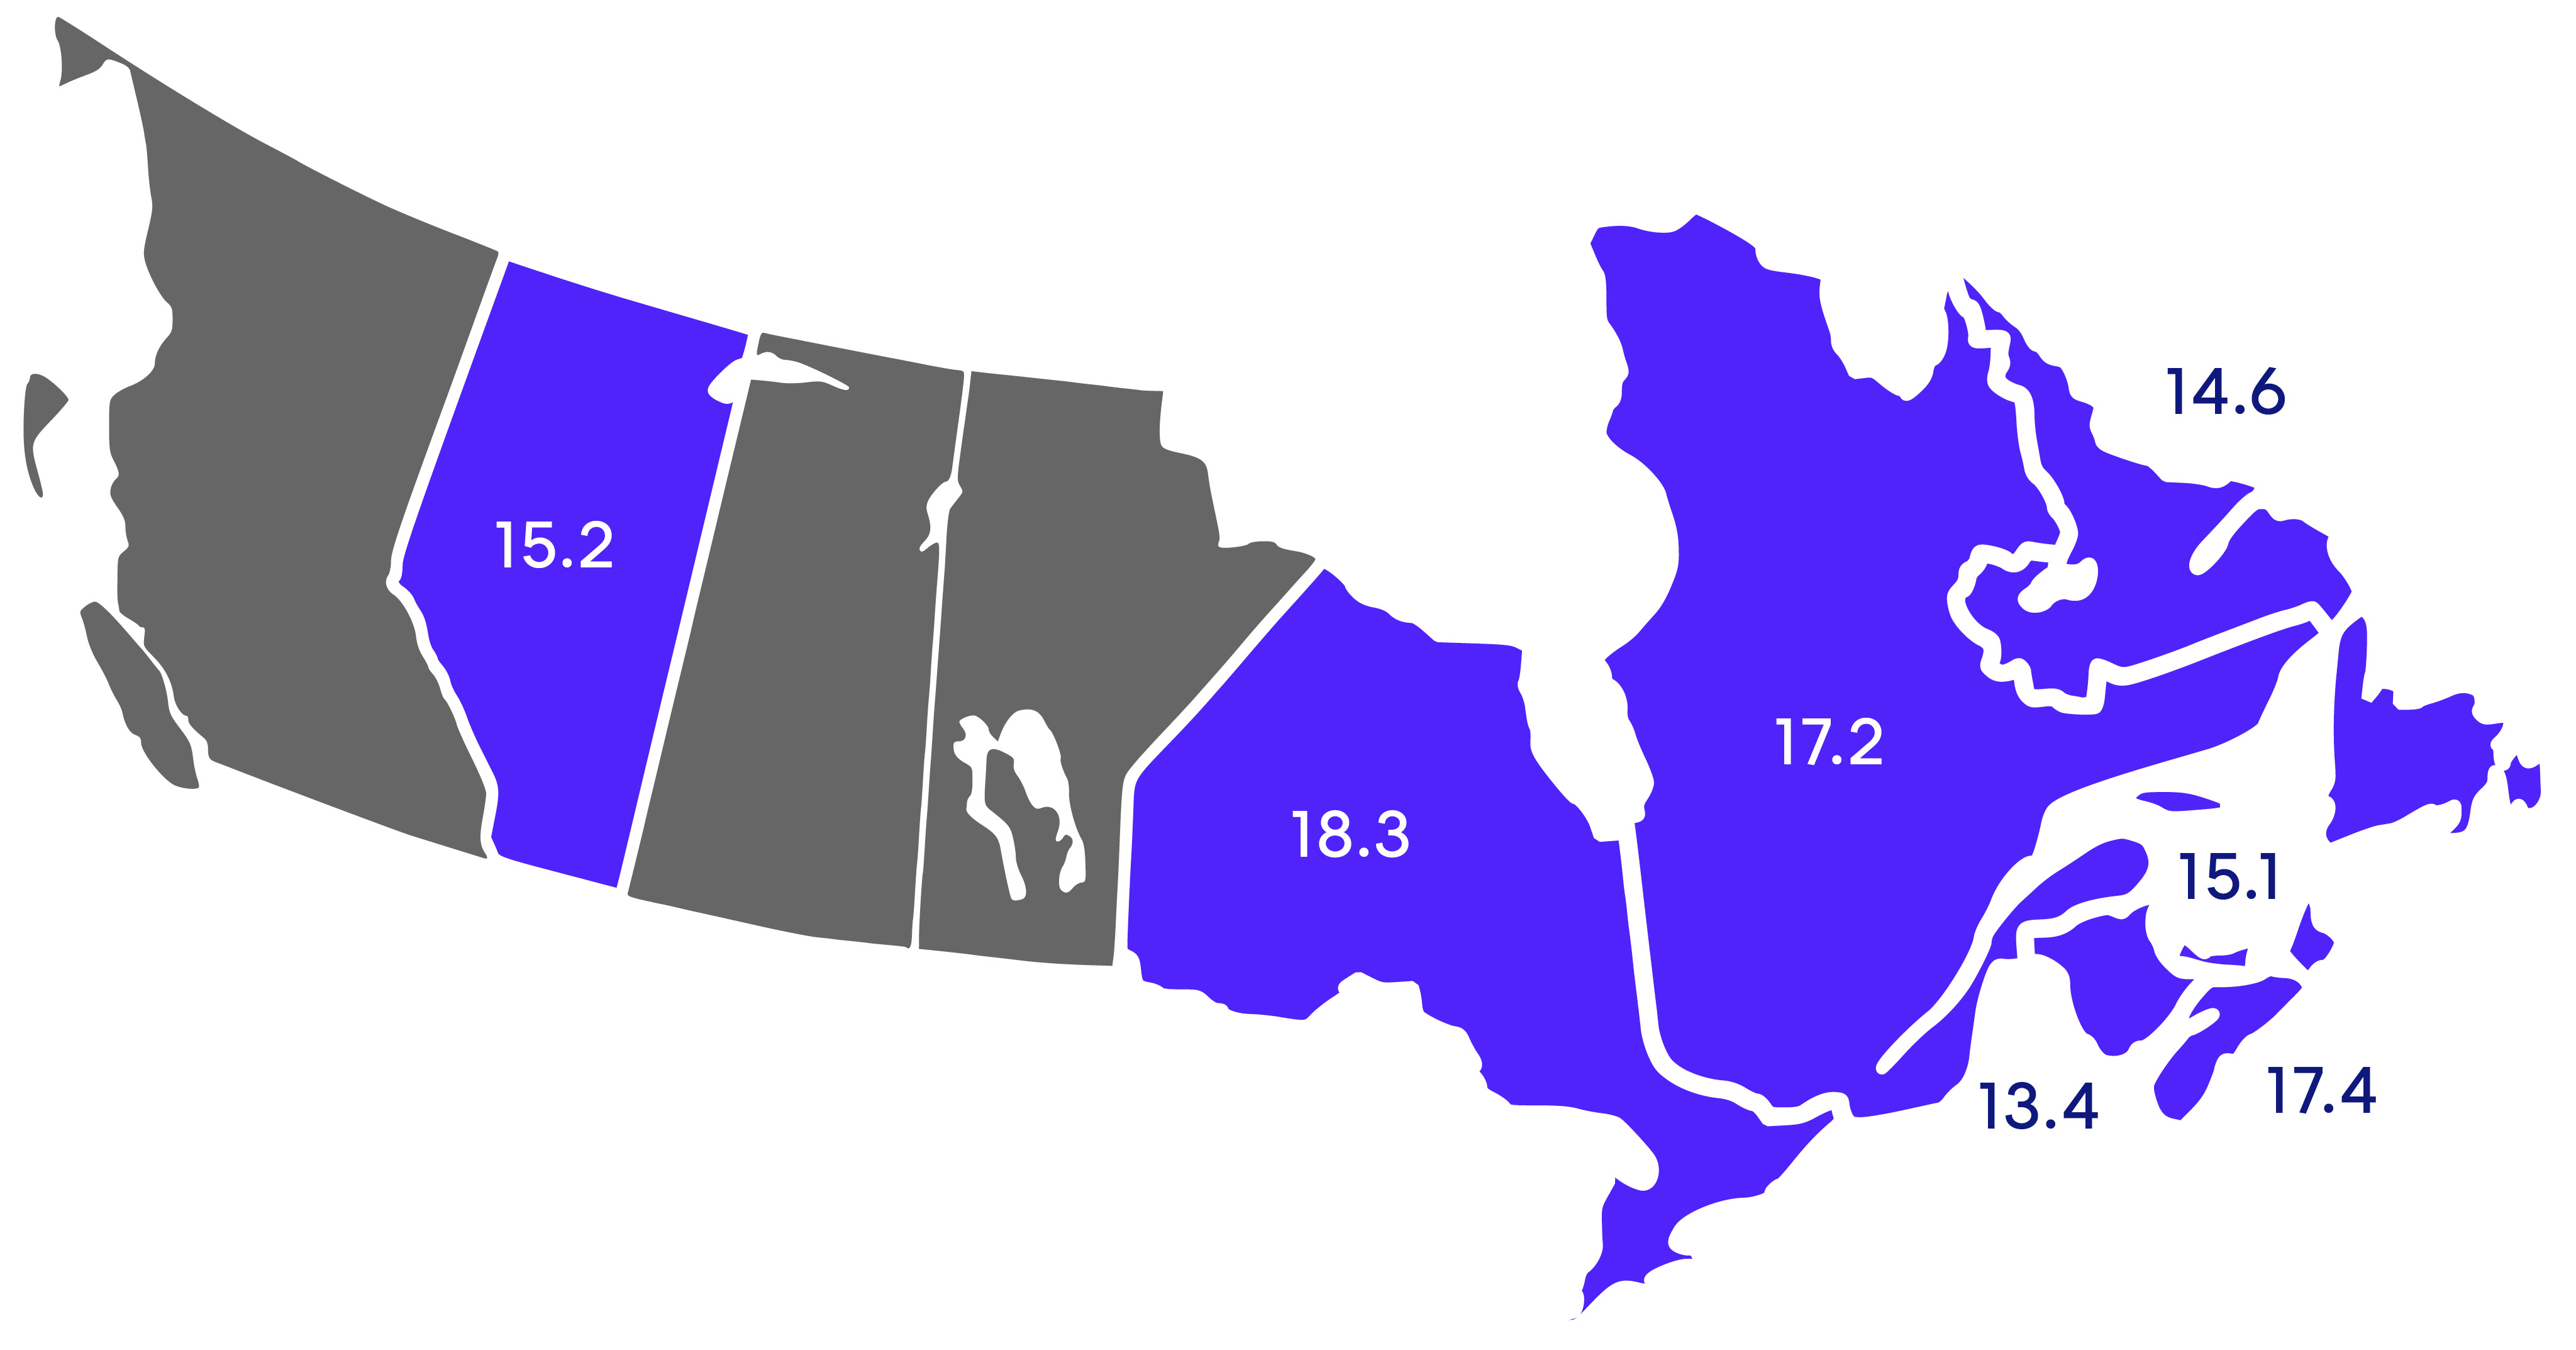
Ontario’s LOR increased 7.2 days to 18.3, which is both the highest overall LOR and the largest increase. Nova Scotia increased 7.1 days to 17.4 days, while Quebec was up 6.9 days to 17.2 days. The lowest overall LOR was New Brunswick at 13.4 days, followed by Newfoundland and Labrador at 14.6 days.
Drivable Claims
LOR for rentals associated with drivable claims was 11.4 days in the second quarter of 2022, a 3.3-day increase from Q2 2021. Ontario’s drivable LOR was highest at 13.2 days, a 4.5-day increase from Q2 2021. Nova Scotia came in second highest at 11.7 days, followed by Alberta at 11.4 days. The lowest drivable LOR was New Brunswick at 8.7 days.
Non-Drivable Claims
The non-drivable results from Q2 2022 were significant. LOR was 30.3 days – an increase of 13.2 days over Q2 2021. All provinces saw large increases; while PEI was highest at 35.4 days, only Quebec (24.1) and New Brunswick (28.4) came in under 30 days.
Total Loss Claims
LOR for total loss-affiliated rentals was 20.6 days in the second quarter, a seven-day increase over Q2 2021. PEI had the highest result at 30.3 days—an increase of 19.7 days. PEI’s results dwarfed Ontario, next-highest at 22.4 days.
Data excludes the private carrier provinces of British Columbia, Manitoba and Saskatchewan.
Summary
The results for the second quarter of 2022 offer several items of note. As noted in the first quarter, the second quarter results are traditionally the lowest of the year. While the historical trending seems to have returned, the results themselves continue to be exacerbated by supply chain disruptions, parts delays, collision repair backlogs, claims process challenges and technician shortages. And with the complexity of vehicle repairs only increasing, for both ICE and BEV models, the entire industry must play a part in ensuring all collision-related businesses are aligned—not just for procedural solutions, but to ensure our mutual customers receive safe and proper repairs, and excellent experience and peace of mind.
Enterprise is committed to partnering with insurers, repairers, and suppliers on each one of these issues. Through foundational support provided by the Enterprise Holdings Foundation, Enterprise is spearheading the Collision Engineering Program, in partnership with Ranken Technical College. The program, designed to attract and develop entry-level talent to fill essential roles within the collision repair industry, is piloting at four schools nationwide. For more information, visit .
The quarterly LOR summary is produced by . Through its ARMS® Automotive Suite of Products, Enterprise provides collision repair facilities with free cycle time reporting with market comparisons, free text/email capability to update their customers on vehicle repair status, and online reservations. More information is available at .


